Interactive data visualization enabled intelligent tracing of suspicious transactions.

- Background
- Crypto fraud was rising. Binance’s risk analysts traced stolen money through a dense table, one account ID at a time, and could close about 10 cases a day while 20 or more came in. Every case left open cost a customer’s trust and let fraud losses grow. I replaced the table with an interactive money-flow diagram, and ==daily case reviews doubled==.
Every case starts with a customer who lost money.
To understand how an analyst finishes a case, I interviewed 25 internal analysts. A case starts as a ticket: a customer reports that 1,000 USDT left their account and asks Binance to get it back. The analyst’s job: ==find the final account that received the money, and every user in the chain.==

Analysts traced the money by hand.
Step one: the analyst types the reported user’s UID, 45530950, into the old dashboard. From there they had to manually search, compare and connect data across modules, writing down each counterparty and searching again, one UID at a time.
Insight. Risk analysts spend significant time ==manually looking up UIDs and piecing together transaction relationships across multiple accounts==.
Transform a fragmented, manual investigation process into ==a visual, intuitive workflow== that helps analysts trace suspicious fund flows faster and make informed decisions.
Interactive data visualization was the big bet.
With the PM and developers, I placed every idea on an impact-effort matrix. Filtering and sorting were easy wins, but they only make the same table faster. ==An interactive visualization changes how analysts work==: it shows how money moves between accounts, which is exactly what they were piecing together by hand.

A correlation diagram was best suited for the task.
I researched different diagram types and compared what each could show. ==Only the correlation diagram simplifies complex relationships and expands as the case grows.==

Link everything.
An easy way to explore the transaction relationships between counterparties.
Put all the data on one graph, so every relationship is visible at once.

==Only 4 of 25 analysts found it clear.== They could not see where the money went, and got lost in the lines.
Group by type.
See where the money goes, and what each transaction means.
Group transactions by type and add arrows to show how the money flows.

==12 of 25 analysts found it clear.== The money flow was clearer, but the groups hid the next layer of counterparties.
Reveal layer by layer.
I went back to the analysts and rebuilt the diagram around three principles: anchor on the case, show depth only when asked, and make status and direction instant.
Discover the next layer of counterparties without a new search.
Click a counterparty to open its own transactions, one layer at a time, on a circular layout colored by status.
==24 of 25 analysts found it clear.== They could see the whole picture and trace the money to the final counterparty.
Color follows what analysts check first.

From the first version to the final one (left to right), color follows the data hierarchy I learned from the PM: ==transaction status, then direction, then counterparty==. Users responded well to the final version.
The first build was a hairball.
The design worked in Figma. With a real case loaded, the engineering build drew every link at once: ==all the lines cluttered together==, and analysts could not see the data clearly.

Draw any number of counterparties around one account, so that no two ever overlap, with a rule the engineers could build.
I sat down with the developers and we worked the geometry out on paper: one central node, lines at equal angles, a circle of room around every counterparty.
Every counterparty sits on one ring around the flagged account, 360° / n apart, with a circle of room of radius x for its label.
Neighbors just touch when sin(180° / n) = x / (x + r). Solved for the ring radius r, the ring is exactly as big as n counterparties need.
==Equal angles keep the lines evenly spaced, and a ring that grows with n keeps labels from ever overlapping.== More counterparties make a bigger ring, not a hairball.

Real cases are messier than the happy path.
==I designed for the extremes, not the average.==

A 3-month window by default, chosen by testing windows with analysts.

Long addresses and IDs are shortened with “…”. Hover to see the whole text in a tooltip.
From one case to the whole queue.
In phase 2, I extended the same thinking to the dashboard level. Instead of showing analysts everything at once, the dashboard surfaces the most important cases, explains why they need attention, and lets them drill into the underlying data when necessary.
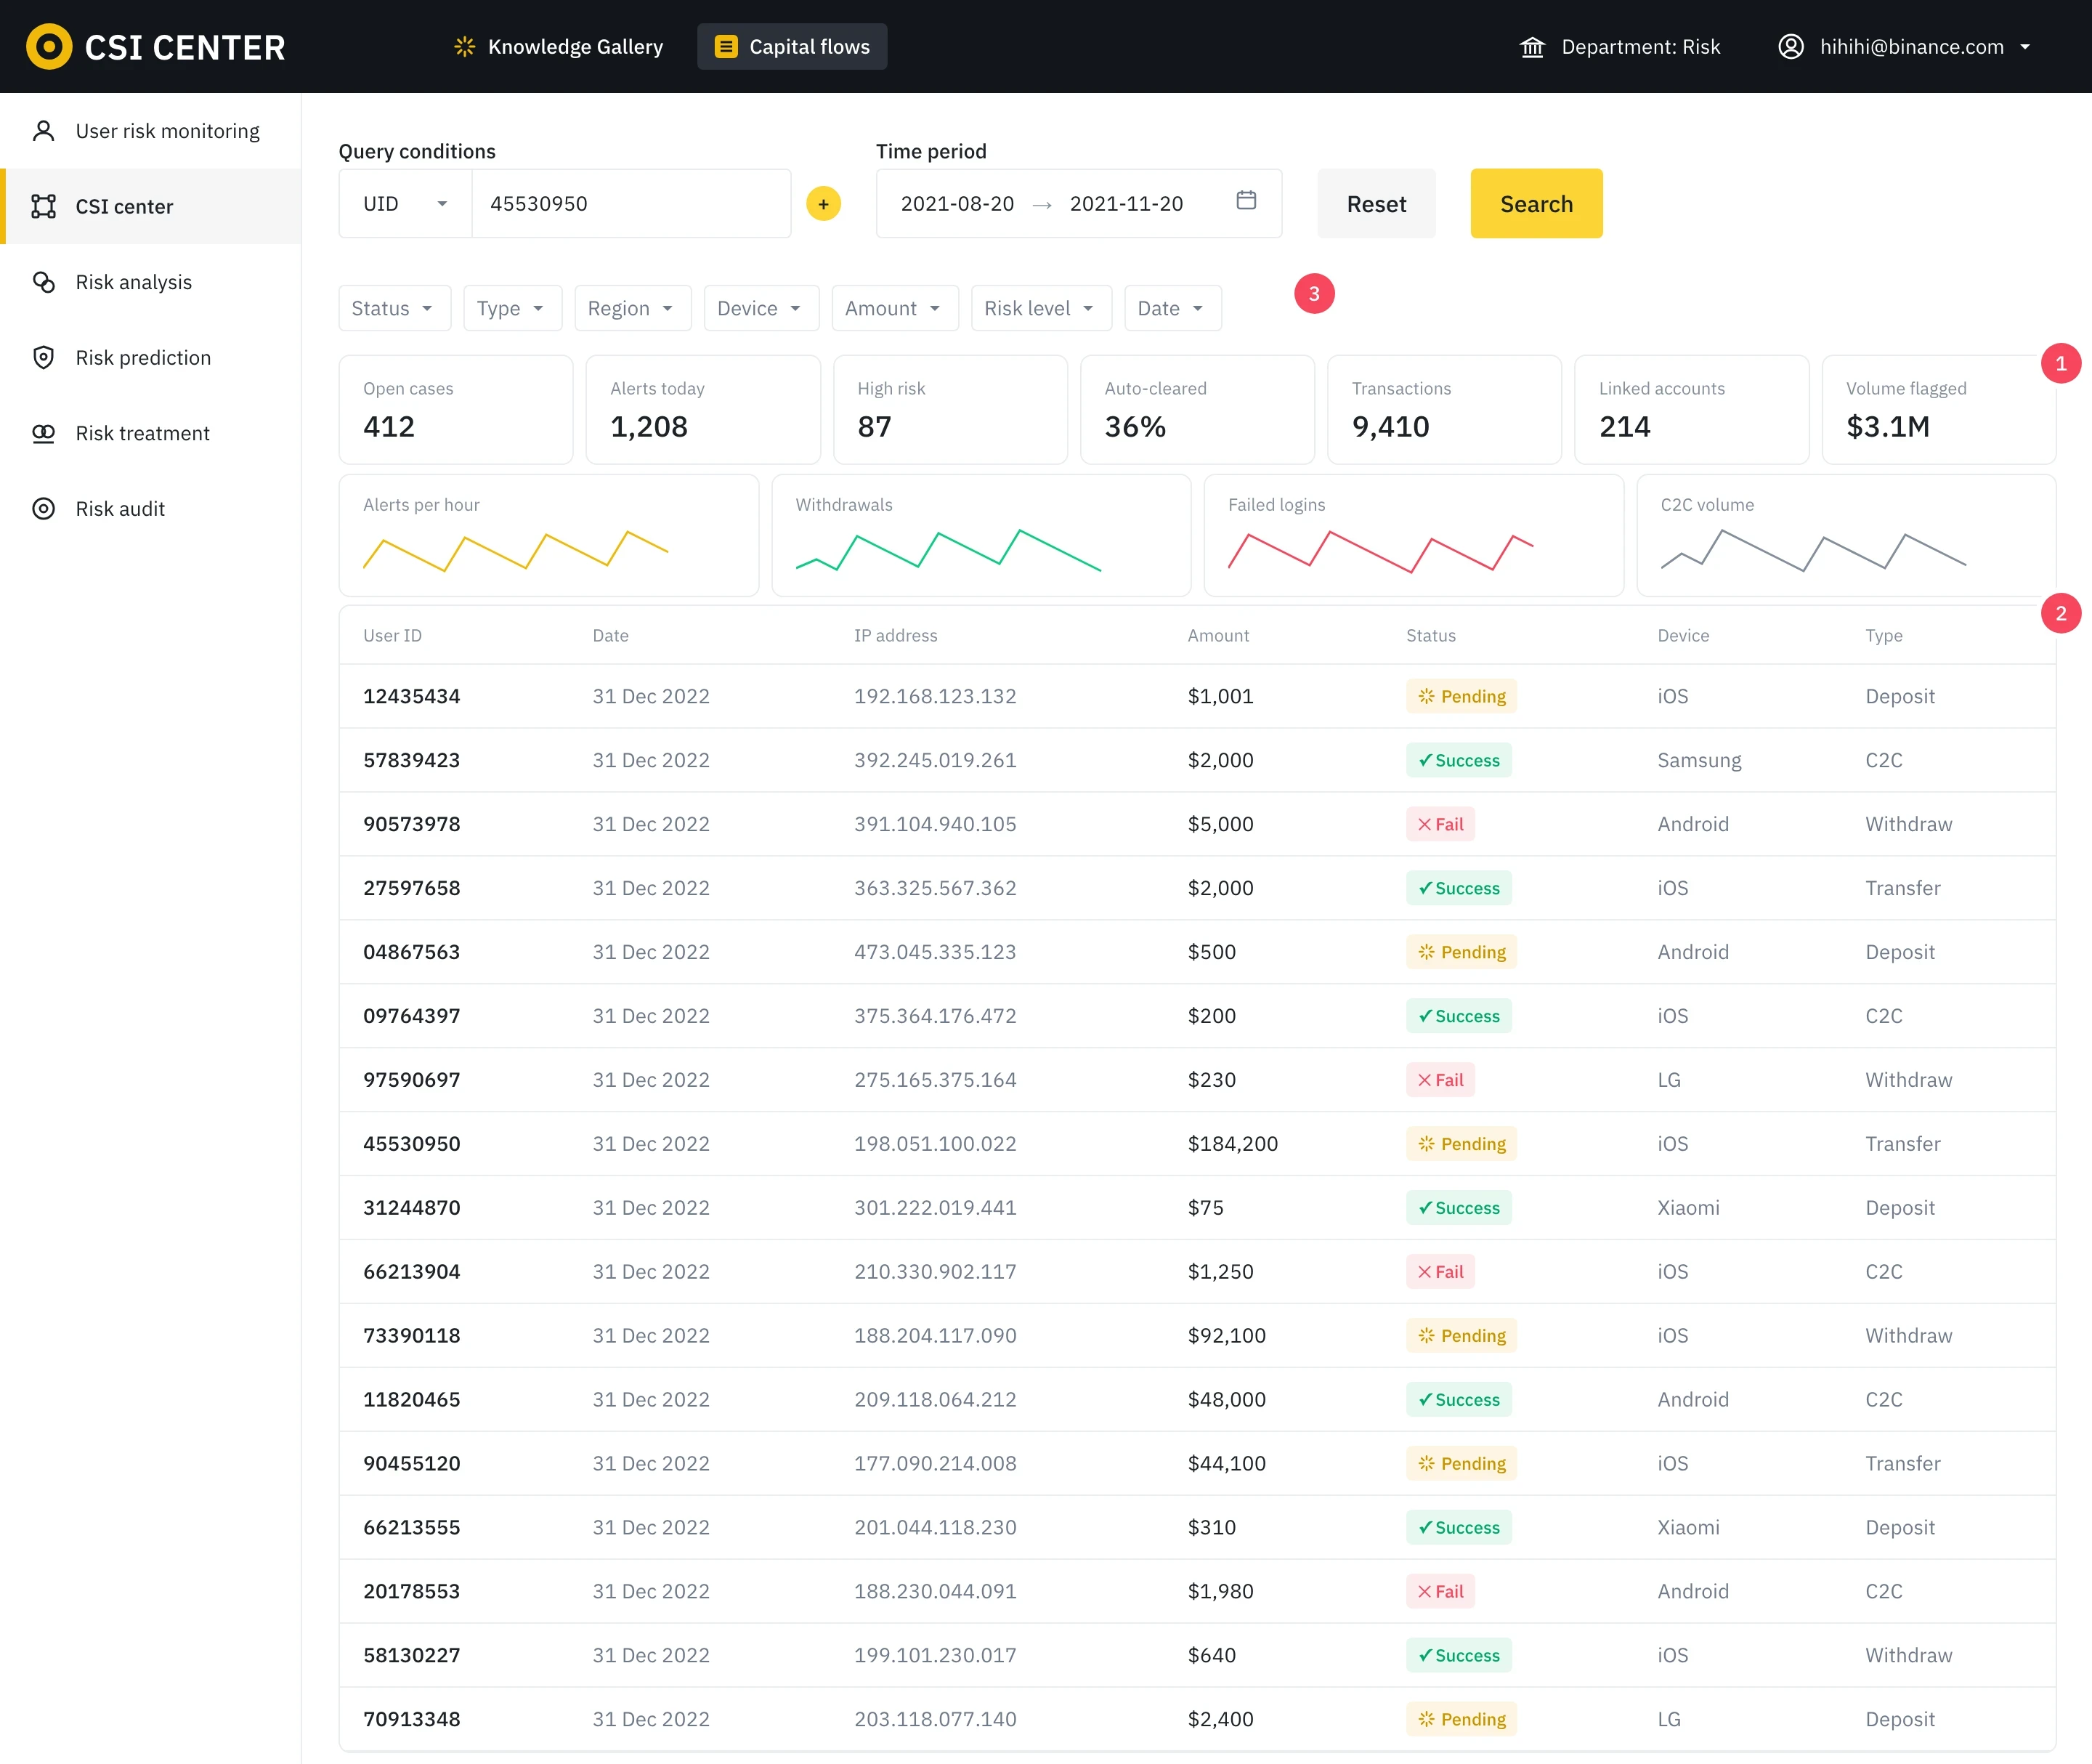
1 · Seven metrics with no priority. 2 · A long table with no reason attached. 3 · Seven filters to set before any insight.
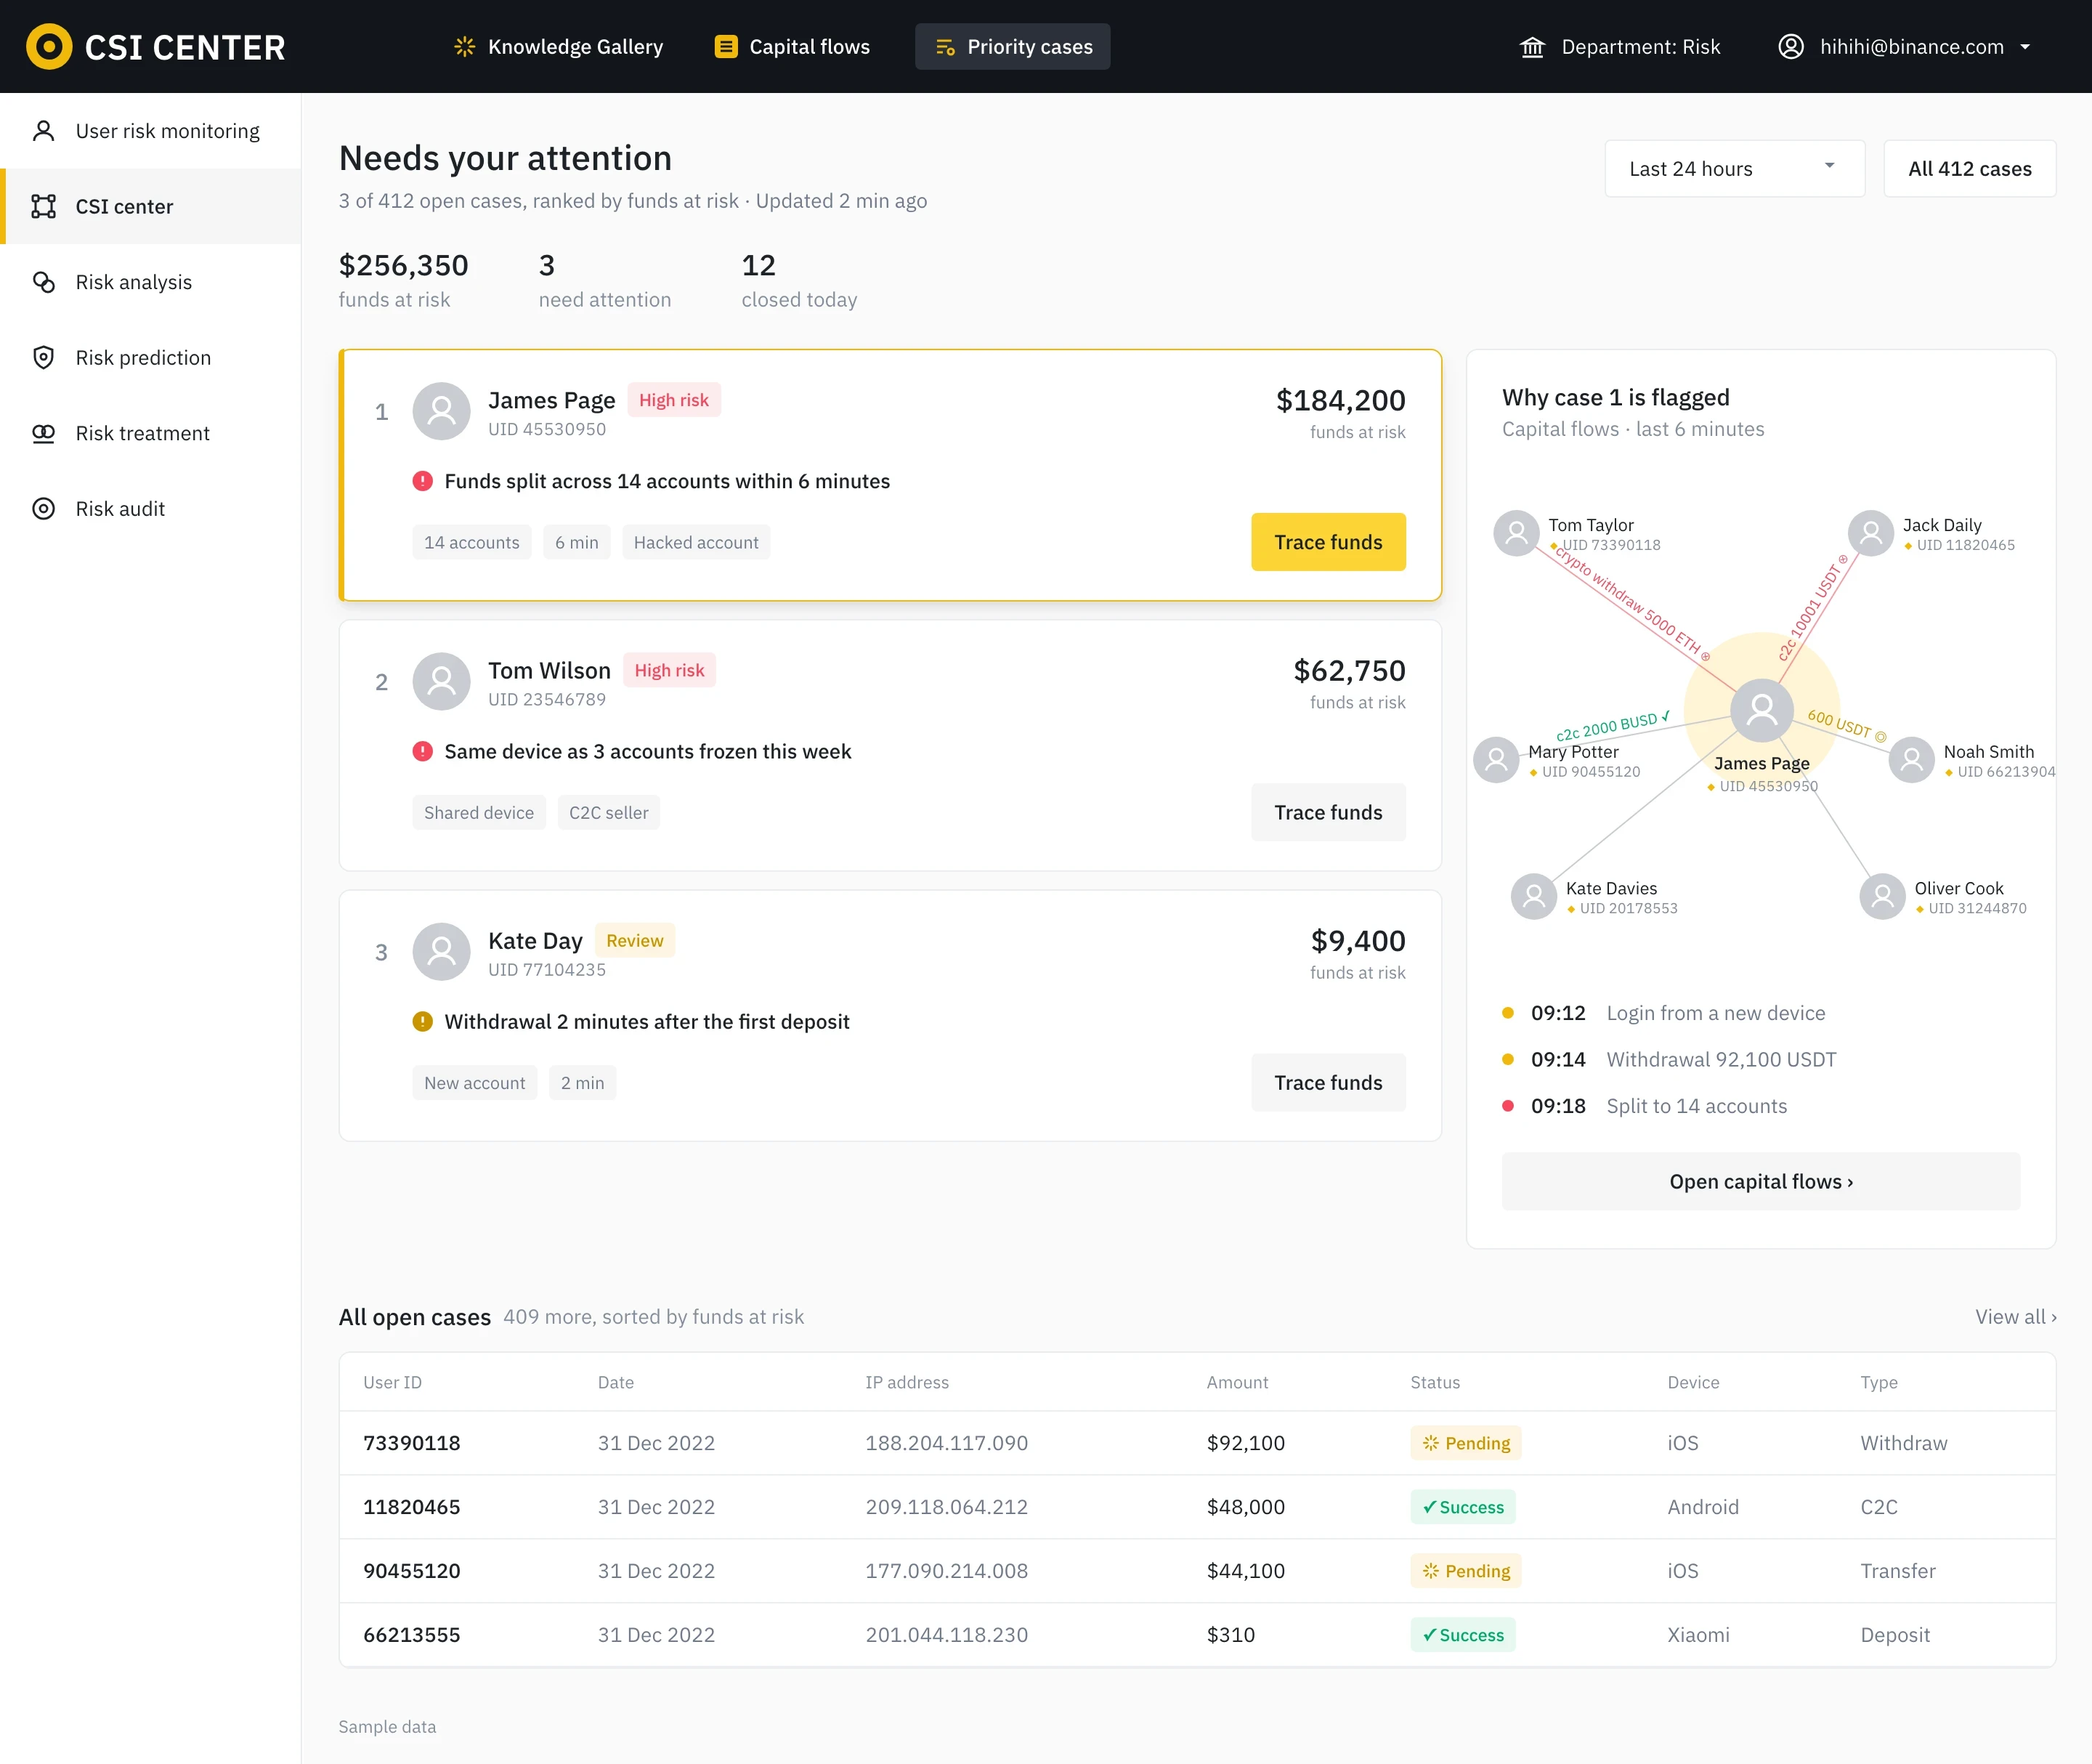
The top cases, ranked by funds at risk, each with a one-line reason, and the money flow one click away.
Seven metrics, four charts and a long table, none of it ranked. The case that matters most sits in row 8.
Faster investigations, less fraud, happier customers.
An efficient workflow let analysts ==close twice as many cases a day==. Fewer open cases meant less fraud got through, and the customers who reported it got answers sooner.

Satisfaction of users reporting to the risk team rose from 50 to 90.

Doubled for all 25 risk analysts, beating the 1.5× goal.

Fewer fraudulent transfers got through once analysts could keep up with the queue.
If I designed it today, an AI agent would trace the chain and act on my approval.
Shipped in early 2024. Analysts still followed the money one hop at a time. Today an AI agent would ==follow it layer by layer to the final receiver==, explain each hop, and act only after the analyst approves.
Why AI: one case can reach thousands of transfers and devices. ==AI searches and analyzes that much data in seconds.==
Follows the money hop by hop until it stops moving: the final receiver.
Says why it took each hop: the same amount, the same device, a brand-new account.
One approval freezes every account on the chain, and it drafts the case report.
How it learns: each case is matched to similar confirmed ones, and every approve or edit trains it. ==Nothing is frozen until a person approves.==
Challenge & reflection
The canvas could not render unlimited history. Testing time windows with analysts gave us the 3-month filter; ==next time I would set that constraint in the first sketch==, not the third.
I learned to present complex data in a format that’s ==easy to understand and act on==, so analysts can decide quickly.
It was a small flow redesign, but it made a ==big impact on the company’s business growth==.